Data Dashboards
The Data Visualizations provide interactive and visual information on various data items. These highly interactive dashboards allow users to drill down and filter to allow detailed exploration.
BOT Performance Metrics
Student, faculty, finance, research, and advancement metrics in dashboard form with peer comparisons where applicable.

Illinois Transfers
Visual flow of students from Illinois post-secondary institutions who transfer into the University of Illinois System, broken down 5 different ways.

Student Data Book
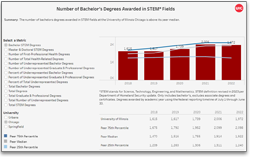
A compilation of student statistics and longitudinal trends related to student enrollment, degrees awarded, and retention and graduation rates.

Faculty Salary Book
Presents high, low, median, and mean salaries, mean employer expenditures for employee fringe benefits, and mean ages of faculty in the system as a whole, by university, by college-level unit, and by department.

Underrepresented Profiles Book
Trend data covering enrollment, retention, and participation of under represented students, faculty, and staff.


NSF HERD Survey
Contains data from the Higher Education Research an Development (HERD) Survey

IPEDS Tuition and Costs Dashboard
Provides three different views of IPEDS tuition and cost data for University of Illinois System universities and their peers.

Postgraduate Earnings & Economic Mobility Dashboard
In 2026, the University of Illinois System Office of Planning & Budgeting partnered with PSEO to analyze graduate earnings outcomes. Using U.S. Census data, the project examines earnings by year, percentile, and degree program, and compares results across U of I universities and peer institutions.